
- Self-assessment
- 10 questions
- A five-minute gut pass
AI Velocity Scorecard
Where did your AI coding gains actually go?
Your team rolled out AI coding tools months ago. Engineers love them, the dashboards show more code, and yet delivery feels the same. Your seniors are buried in review, and someone upstairs is about to ask what the licenses bought. If that sounds familiar, this scorecard is for you.
The industry data will not settle it for you: DORA, the DevOps Research and Assessment program at Google, now calls AI an amplifier of whatever your delivery system already was. So the question is not whether AI works, but which way it amplified you. That is what the ten questions tell you.
You will not have to dig far. Most of these numbers already sit in GitHub or GitLab, in Jira, or in your DX (getdx.com), Jellyfish or LinearB dashboard if you run one. Answer everything from memory first, in five minutes, then check only the two or three numbers that decide your verdict. Without one of those tools, expect a short script against the GitHub or GitLab API for two of them: the built-in insights pages report neither reviewer distribution nor median time to merge.
Written for engineering leaders of roughly 50 people and up, at least two quarters after an AI rollout. Running smaller? Read on, but hold the numbers lightly: at that scale they move too much month to month.
A verdict in plain words: the one place your gains are leaking, and the first move to make about it on Monday.
The three numbers that show what the AI licenses actually bought, instead of adoption percentage.

The ten questions
Answer for the period since your AI rollout, against the six months before it. A rough answer is fine on every question: answer from memory first, then pull real numbers only for the two or three that decide your verdict. Data beats memory, but memory beats never finishing. The points are printed on every answer, and the tally at the bottom of your screen updates as you go.
One caution. A hiring wave, a migration or a reorg in the same window moves these numbers too. If one of those happened, write it down. This scorecard describes where you are. It does not prove what AI did.
8 scored questions still to answer.
Your verdict appears here, with nothing to fill in first.
Show me an example resultYour verdict
How this is counted
Q1 and Q10 carry no points, and it says underneath each one why.

Burden dominates
The Review Wall
Your AI gains are leaking into the review queue. The tools multiplied code production, but every PR still passes through the same few heads, so the gain became senior review hours instead of shipped work.
It is the pattern I hear most often after a rollout: volume rises sharply, review time follows, delivery stays flat. Your bottleneck was never writing code. It is how fast somebody with system context can validate it.
One chart, half an hour in your repo analytics: share of all reviews done by your top three reviewers, month by month since the rollout. A climbing line means your delivery capacity is capped by three people’s calendars, and you can show that without buying a thing.
Quality dominates
The Rubber-Stamp Regime
Your AI gains are leaking through the quality gate. Review volume grew past what your team can absorb, so approvals became a formality: fast, zero comments, rising reverts.
Velocity may even look fine, which is the dangerous part. You are shipping code that nobody fully understood, and paying for it later in incidents and rework.
Pull the last twenty PRs approved in under 15 minutes with no comments, bots excluded, and read them. Count how many touched something you would have wanted a conversation about. That count, not the rate, is what moves people internally.
Context dominates
The Comprehension Gap
Your AI gains are leaking into re-explaining the system. Knowledge of how and why things work lives in a handful of heads, so every review, every onboarding and every incident routes through the same people.
AI-generated code made the pile they must explain bigger, not smaller. The team is not slow at writing code. It is slow at understanding what already exists.
List the modules only one person can review. That list is your real velocity ceiling, and your risk register if any of those people resign.
Leak total 0 to 3
Actually Flowing
Rare, and worth protecting. Review is keeping up, and knowledge is spread wide enough that validation scales with generation. Check that Q6 stays low as volume grows, because rubber-stamping is how flowing teams quietly break.
Set a calendar reminder to re-run these ten questions in one quarter. This verdict has a short shelf life.
At 8 of 12 the leak shows in more than one dimension, so the Monday move above is a first cut, not the whole fix.
If two dimensions are within a point of each other, read both verdicts: your leak is not clearly in one place yet.
Flow reading 0 of 4.
How to read the score. The pass mark is deliberately narrow: 0 to 3 out of 12 means your ability to check code grew as fast as your ability to write it. Few teams are there two quarters into a rollout. Treat the verdict as a direction, and the change between two quarters as the real result, not a grade.
Where this comes from. DORA’s 2025 report puts it this way: “AI’s primary role is as an amplifier, magnifying an organization’s existing strengths and weaknesses. The greatest returns on AI investment come not from the tools themselves, but from a strategic focus on the underlying organizational system.”
+ Show the 2024 numbersIf somebody quotes the older figure at you: the 2024 edition found a 25 percent rise in AI adoption associated with a 1.5 percent drop in throughput and a 7.2 percent drop in stability. The 2025 edition did not publish comparable percentages; it reports directions. Throughput turned positive: teams that adopted more shipped more. Stability stayed negative: adoption still goes with more change failures and rework. DORA’s ROI of AI-assisted Software Development report calls that extra checking a verification tax. None of it tells you which way your own system amplified. Your answers above do.
You answered Q4 as not measured, scored as one point. Your Burden reading rests on Q5 alone, so read it as a direction. Having no review-time telemetry is itself a finding worth writing down. The page in the email has a version of that number you can compute without it.
You answered without a usable baseline, scored as one point. That dimension is a direction, not a measurement. If the rollout was more than a year ago, or the team and the tooling changed twice since, the before-and-after is confounded beyond repair: run the same questions across two teams in the same quarter instead, one that adopted heavily and one that did not, matched on size and codebase age.
You are measuring the rollout with adoption numbers, and adoption is a cost metric, not a return metric. The three numbers below are the answer that survives the meeting where somebody notices.
The three numbers to show the board
Your verdict tells you where the gains leak. A board will ask a different question, and adoption percentage does not answer it. Three numbers do, and they fit on one page.
Unlock more
What you get in the email
One page you have not seen yet.
The page for the budget meeting
- 01Three numbers. With the formulas, and where to find the data.
- 02One line to say in the room. Three blanks for your own numbers.
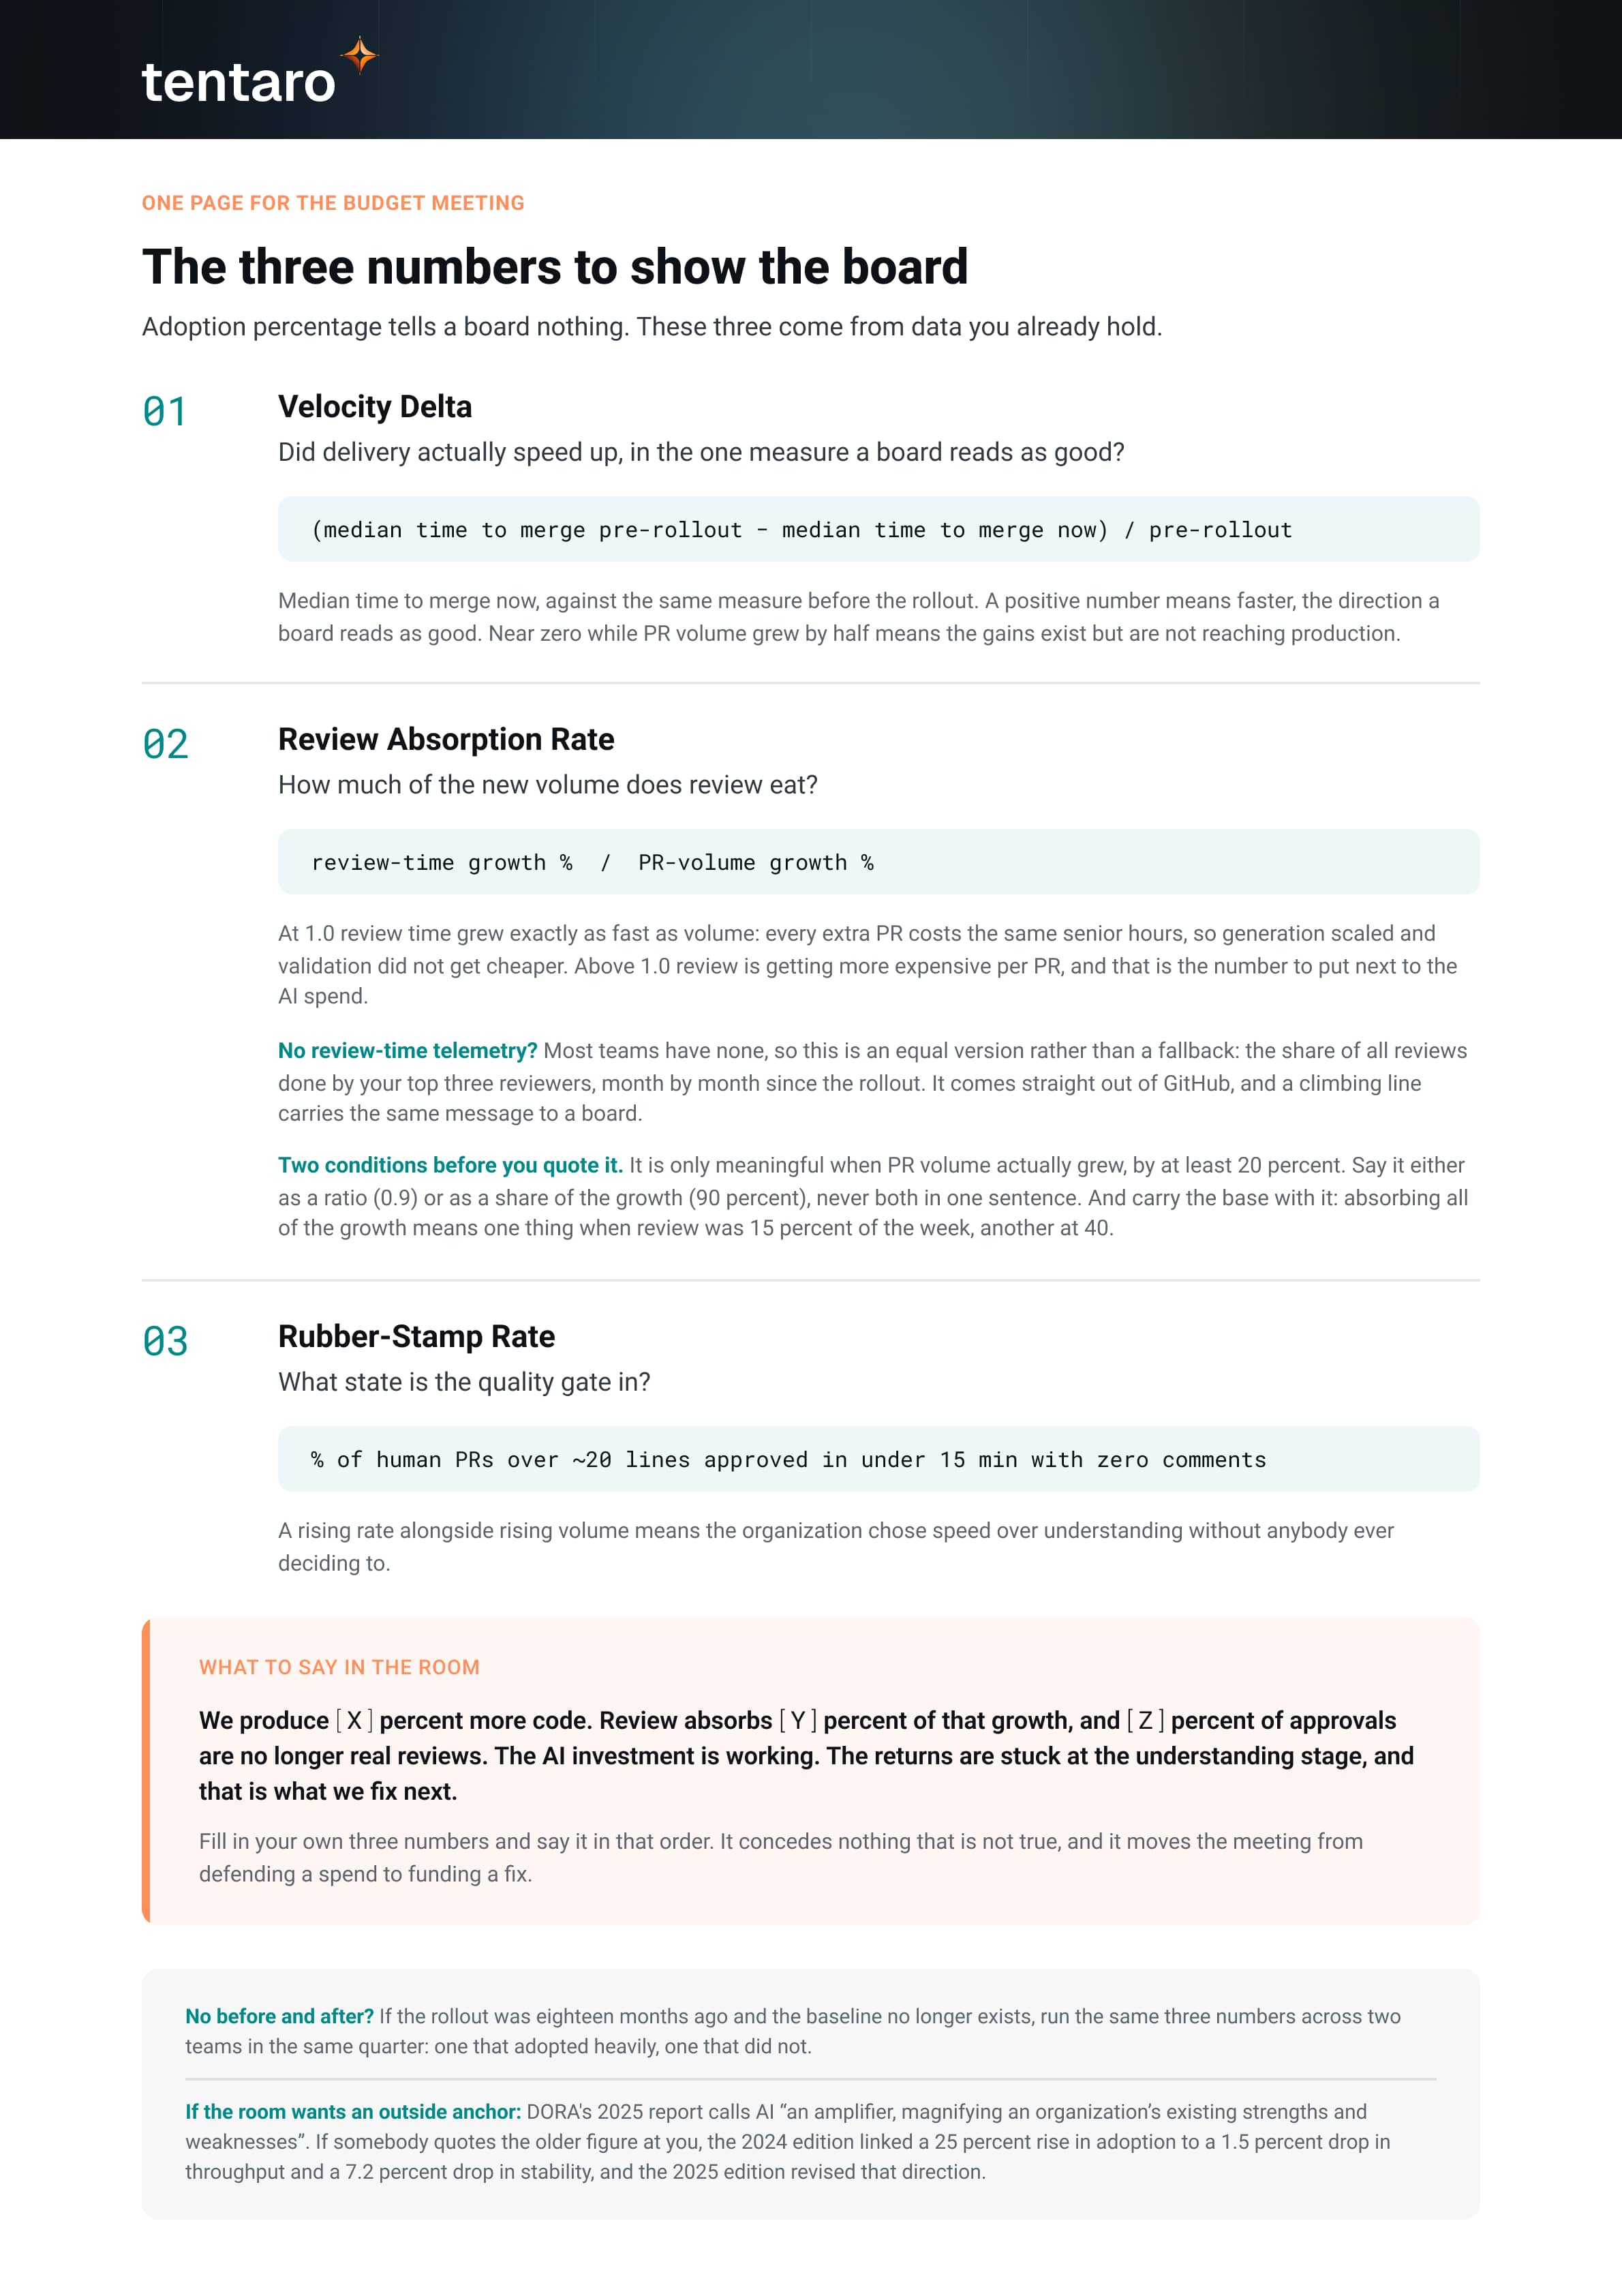
Sent. The page for the budget meeting is on its way to your inbox, with the three numbers, the formulas and the one line to say in the room.
It takes a few minutes to arrive. If you do not see it, check your spam folder.

Why a founder wrote you a scorecard
Because the same story kept coming back. I have had a lot of conversations with engineering leaders this year, and in many of them I heard a version of this: the tools work, the code arrives faster, and delivery does not move. I wanted a way for someone to check that on their own numbers, without me in the room.
What to do with your result
One. Do the Monday move for your verdict, this week. Half an hour, your own data, no budget needed.
Two. Put the ten questions in the calendar one quarter out. One score is a snapshot; two are a trend, and the trend is what tells you whether anything you change is working.
Three. Take the three numbers into your next AI budget conversation. They answer the question that adoption percentage cannot.

Tentaro works on the piece behind these numbers: what your team knows about its own codebase, and how much of that sits in a few senior heads. That is what puts your review queue behind those people, and what turns an unfamiliar part of the system into a guess for everybody else.
How it works: you ask a question about your codebase in plain language, and the answer comes back with the code it stands on, so you can check it instead of trusting it. It runs on one machine inside your network, on your repositories, for your team and for the AI tools they already use, and your code does not leave it.
If you landed on the Review Wall or the Comprehension Gap, reply to the email with your scores. I am curious what came out. If you want to talk it through, write back and we will find a time. If Tentaro is not for you, I will say that too.
Warm regards,Aleksandra Bury, CEO & Co-founder
If you want to see what Tentaro actually is, the demo runs on open-source repositories we have already indexed. Ask a question about a codebase and the answer comes back with the code it stands on. Nothing of yours goes in.